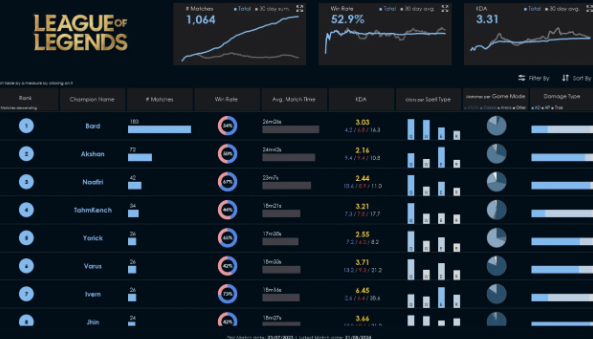
For me, esports has long gone beyond simply watching broadcasts on a monitor screen. I believe that today the viewing experience directly depends on access to up-to-date numbers right during the match. Real-time statistics monitoring turns passive observation into a thoughtful analysis of what is happening in the virtual arena. Understanding the current economy of the teams provides a clearer picture of the professional players’ tactics. I am confident that it is the live numbers that help to better read the game and predict the outcome of a battle before it begins.
Deep Dive into the Macro Game
In modern esports disciplines, it is no longer enough for me to just watch beautiful button pressing and perfect mechanical execution. It is important to understand the global map and evaluate the teams’ macro decisions in the long term. This is especially true for the MOBA genre, where every action in the lane, competent ward placement, or control of the enemy jungle has a cumulative effect throughout the entire game. Without understanding these basic processes, the viewer sees only chaotic skirmishes, missing the complex tactical game played by professional rosters.
Tracking the spawn timings of neutral objectives and the cooldowns of ultimate abilities completely changes the perception of the match. If you use league of legends live scores during the viewing to monitor the gold advantage and collected items, the logic of esports athletes is revealed in a completely different way. It becomes extremely clear why a squad makes the decision to retreat from the dragon and give up an important objective without a fight – dry statistics show a real lack of resources for a full-scale team fight. Such an analytical approach eliminates the erroneous subjective assessment from simple visual dominance on the screen and gives an accurate picture of the champions’ power at a specific minute.
The developers themselves perfectly understand the value of open data, which is why Riot made a great feature on Twitch that takes the viewing experience to a new level. Right on the official broadcast, you can open an interactive panel and separately view the statistics of each champion, study their current build, the amount of earned gold, runes, and damage metrics. The presence of such a built-in tool makes watching matches significantly more pleasant and convenient. This allows you to evaluate the impact of a specific player and understand the economic situation on the map in one click, without taking your eyes off the main action.
Reading Economy and Hidden Dynamics
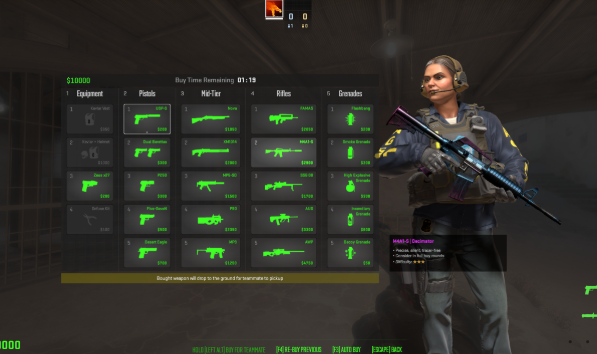
In a tactical shooter like Counter-Strike 2, dry statistics are the foundation for understanding the game. The teams’ purchases directly dictate the round’s pace and map control strategy. With an open economy table, it is immediately clear when a squad is forced into an eco-round to accumulate funds, or preparing an aggressive push on their last credits. Knowing the financial situation of both sides lets you predict attack vectors or heavily defended points long before the first shot is fired.
The same applies to Dota 2, where net worth graphs and buyback availability literally write the script for the next five minutes. Tracking the gold difference between key heroes reveals the true balance of power. Without this data, viewers only see the aftermath of a sudden lost fight, but with it – the logic, caution, or calculated aggression behind every map movement becomes clear. A core hero’s buyback status is often the deciding factor during a base siege, making you watch their actions much closer.
In both disciplines, hidden match dynamics are fully revealed solely through live numbers. Players might bluff a bombsite hit or a Roshan attempt, but economic statistics never lie. For me, monitoring these indicators is like reading the team captains’ minds. It makes it obvious why in one situation a tactical advantage is sacrificed to save a sniper rifle, and in another – the team goes all-in to turn the tide of the entire series.
Evaluating Individual Player Contribution
Official broadcasts often focus exclusively on highlights, overlooking the invisible but critical work of other roster members. Live statistics help me objectively evaluate each athlete’s actual impact, away from the commentators’ excitement. It is the numbers that allow you to analyze the match and see the true foundation of a victory.
An excellent example is support roles in League of Legends or Dota 2. They may have a modest kill score, but their kill participation and vision control show a massive contribution to the macro game. Without data on ward placement or healing, it is impossible to fairly assess how well a support enabled their carries.
Tracking damage per minute or dynamic KDA is a great way to independently find the real MVP. In CS2, an entry fragger might die first, but their opening duel stats and ADR prove their value in taking bomb sites. Open metrics objectively reveal the initiators and “dirty workers” who actually forged the team’s win.
Additional Excitement and Anticipation
Having up-to-date data right in front of your eyes creates a specific level of tension while watching. For me, the ability to track live timings and resources adds depth even to the quietest parts of the match. When teams methodically farm or slowly take positions on the map, statistics keep you from getting distracted from the screen. By analyzing experience and gold graphs, you can precisely determine exactly when the power spike of a specific draft will occur. This is akin to reading a good thriller, where the viewer, thanks to the numbers, already knows about the impending threat, while the opponents – not yet.
The anticipation of inevitable clashes becomes much sharper if you deliberately track the economy. When I see in Dota 2 that a carry is just a couple of hundred gold short of buying a Black King Bar, every action in the lane turns into real suspense for the viewer. A similar situation regularly arises in Counter-Strike 2: the realization that the defense has exactly 4700 dollars to buy an AWP before the deciding round makes you watch the grenade throws with doubled attention. It is the statistics that show that fine line separating the squad from failure or a successful comeback right now.
Instant updating of metrics allows you to literally feel the pulse of the game every second. This approach turns watching even an average regular split match in League of Legends into a captivating process of searching for non-obvious patterns. Constantly checking the data helps me not just to observe the mechanical execution, but also to verify my own analytical predictions in real time, evaluating how competently the teams are implementing their initial tactical plans.
Conclusion
To sum up, watching esports tournaments with the use of additional statistical tools takes viewer engagement to a whole new level. It provides an excellent opportunity not just to cheer for your favorite tags, but also to develop your own analytical understanding of game mechanics. I recommend everyone try this format of viewing – going back to the standard broadcast without extra data simply won’t be as interesting anymore.